
https://github.com/jqPlot/jqPlot/blob/master/src/jqPlotOptions.txt
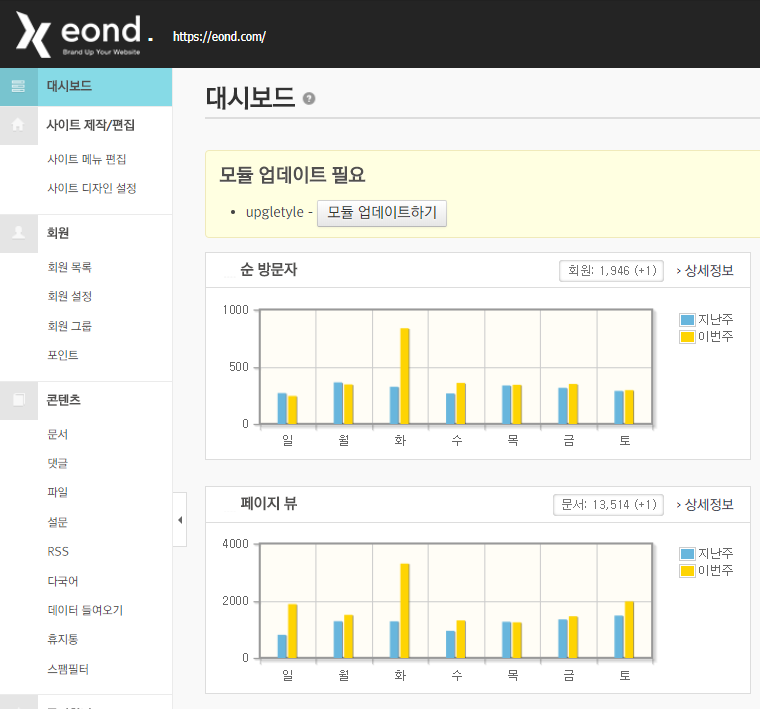
XE 관리자 대시보드에는 jqPlot 차트를 사용합니다.
js를 좀만 손 보면 되긴 하는데요..
./modules/admin/tpl/js/dashboard_counter.js
여기에 해당 코드를 넣거나, 따로 추가하거나..
seriesDefaults:{
   renderer:$.jqplot.BarRenderer,
   rendererOptions: {
      fillToZero: true,
      barWidth: 8,     // width of the bars.  null to calculate automatically.
      // barDirection: 'vertical', // vertical or horizontal.
      // group (same category or bin).
      barPadding: 2,      // number of pixels between adjacent bars in the same
      barMargin: 1,      // number of pixels between adjacent groups of bars.
      shadowOffset: 1,    // offset from the bar edge to stroke the shadow.
      shadowDepth: 1,     // number of strokes to make for the shadow.
      shadowAlpha: 0.5,   // transparency of the shadow.
   },
},
seriesColors:['#68b6dd', '#fed403'],
series:[
   {label: xe.lang.last_week},
   {label: xe.lang.this_week}
],
seriesColors에 색상값을 넣어주거나
redererOption에서 barWidth를 조정하거나 정도입니다.